SIGN IN YOUR ACCOUNT TO HAVE ACCESS TO DIFFERENT FEATURES

FORGOT YOUR PASSWORD?

FORGOT YOUR DETAILS?

AAH, WAIT, I REMEMBER NOW!

Mario Randholm

  • LOGIN
  • Daily “Rutina”
  • Hello, I’m Mario.
  • Blog
  • Resources
    • Downloads
    • Partners
      • NinjaTrader
      • IBKR Podcast (Interview)
      • LSEC (Refinitiv)
      • MultiCharts
      • Municipalidad de Miraflores
      • TradingDiary Pro
    • Mario Randholm (Bio)
    • R Option Model
    • Join Discord
    • Comparison Matrix
  • FAQ
    • Term of Service
  • My Role
Contact Us
randholm
October 15, 2014 12:47 am / Published in Market Update

Mercados Internacionales #SPX


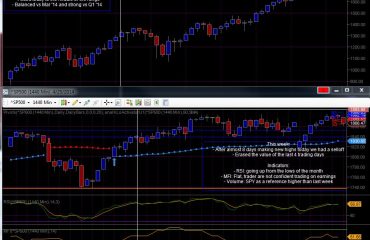
Desarrollo con datos el analisis del gràfico de abajo.  Enfoquémonos en las líneas verticales azules, los triangulos azules y el “<” del cierre del día.


·         Las lineas azules indican el nivel de precio “justo” del mercado, donde los mayores trades y players se sienten cómodos operando. Cada día ha ido descendiendo, esto es negativo.

·         El triangulo azul es el precio de apertura, que tambien ha ido cayendo.


El punto más importante es donde he colocado los circulos con los numeros 1 y 2, ya que son precios que el mercado a aceptado como vàlidos al día siguiente con Asia y EU continuando tendencia. Como se puede ver día 10 cerramos casi en mínimos y  con muy pocos contratos operados en ese nivel. Normalmente estos cierres suelen ir unidos a subidas en la apertura, sin embargo el lunes 13 abrimos por debajo del viernes pero pasamos muchas horas del día por encima de la apertura (pensé que no podía continuar cayendo). Mas tardes, al cierre se repite la estructura del viernes cerrando en minimos alejados de la zona “justa” de precios. Esto nos lleva al día de hoy martes 14.

Abrimos por debajo de ayer, demostrando que no hay compradores agresivos y volvemos a operar muchas horas donde el día anterior apenas hubo volumen.  Esto quiere decir que los participantes del mercado aceptan como válidos los niveles del día anterior.


Hoy el mercado operó cercano a los mínimos del día anterior y parece que los vendedores no presionaron es estos niveles. 


Con estos datos me resulta complejo decidir si nos vamos a dar la vuelta. Lo que me queda claro es que la recuperanción en V rápida esta decartada, para ello necesitamos ver sobreventas como la del viernes o la de ayer.


Si no llegamos esta semana a la zona de 1900 para probar la fuerza de los bulls esa zona puede convertirse en resistencia.



What you can read next

Market Analisys – Caution at current levels could be forming a top.
New target 1900 #SPX
MTD Closing Data

Join the Free Newsletter
Bold conversations, dive into idea clash with exclusive insights

Únete Gratis
Conversaciones audaces donde se permite el choque de ideas y perspectivas exclusivas

This field is required.

Check your inbox or spam folder to confirm your subscription.

Categories

Twitter

Lightning fast alerts:

twitter.com/MarioRandholm

twitter.com/RandBots

Archives

Privacy & Cookies: This site uses cookies. By continuing to use this website, you agree to their use.

To find out more, including how to control cookies, see here: Cookie Policy

ABOUT US

Mario Randholm Blog. Mario is the founder of Randholm & Co. S.A.C., an investment management company dedicated to producing superior returns for its clients and employees by adhering to mathematical and statistical methods.

CONTACT US

Message us

Mario's Linkedin

Disclaimer:

Risk Disclosure: Futures and forex trading contains substantial risk and is not for every investor. An investor could potentially lose all or more than the initial investment. Risk capital is money that can be lost without jeopardizing ones’ financial security or life style. Only risk capital should be used for trading and only those with sufficient risk capital should consider trading. Past performance is not necessarily indicative of future results.

Hypothetical Performance Disclosure: Hypothetical performance results have many inherent limitations, some of which are described below. No representation is being made that any account will or is likely to achieve profits or losses similar to those shown; in fact, there are frequently sharp differences between hypothetical performance results and the actual results subsequently achieved by any particular trading program. One of the limitations of hypothetical performance results is that they are generally prepared with the benefit of hindsight. In addition, hypothetical trading does not involve financial risk, and no hypothetical trading record can completely account for the impact of financial risk of actual trading. for example, the ability to withstand losses or to adhere to a particular trading program in spite of trading losses are material points which can also adversely affect actual trading results. There are numerous other factors related to the markets in general or to the implementation of any specific trading program which cannot be fully accounted for in the preparation of hypothetical performance results and all which can adversely affect trading results.

Testimonials Disclosure: Testimonials appearing on this website may not be representative of other clients or customers and is not a guarantee of future performance or success.

Disclaimer:

This site is for informational purposes only. Nothing on this site should be considered investment advice or as a solicitation to buy or sell any security.

Past performance is no guarantee of future results.

Please see our full Disclaimer.

TOP
“It requires a great deal of boldness and a great deal of caution to make a great fortune; and when you have got it, it requires ten times as much wit to keep it. – Nathan Mayer Rothschild.”
+ +