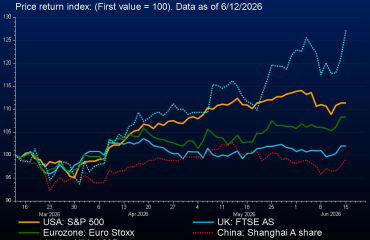
Contrary to most market participants the SP500 is now near April high and back to the supply area shared in the chart. The chart below shows FANG stocks YTD and the SPY. #AMZN and #MSFT positive YTD
My systems are reading Mutual Funds buying and a significant lack of sellers at current prices, if this continue the auction prices will be force to look for sellers higher.
Last Friday the SP500 closed right on the yellow trend like that I shared a few days ago. Officially with today closing action, that line is not longer valid. This does not mean much to the future prices of the SP500, it is just a simple indicator to help me understand that is market is not trading as expected.
This week we will be having earning that will shape the maker view. Most likely, most large investors are holding their longs or short until we have new information.
In the chart below you can see the FANG stock YTD and the SPY