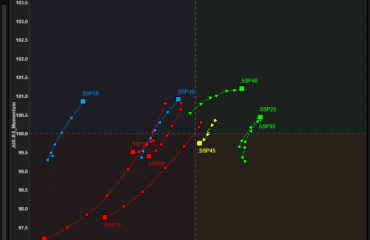
I have added this chart to the sticky post of the blog, right under the SP500. This will update automatically each day after the close.
INTRADAY AND DAILY PRICE ACTION HAVE AUTO-CORRELATION:
The VIX and daily returns on Indexes experience clatters of volatility, thus when we have a large block of outliers in any direction you can expect to have similar ones an opposite forces on the other side.
Of course the most difficult part is to know when.
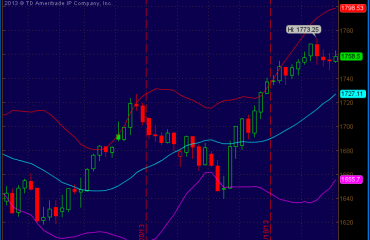
In the BOX 1 it took 7 trading days to the down side to have a strong day to the upside. In BOX 2 it have taken 3 consecutive negative days to have a strong day.
Tomorrow we this chart will show the return for today on the SPX about +2.01%.
You can copy the link for future references. https://bit.ly/2FeTUub
For tomorrow I do not know the price action. But if bears are done selling, the low should be respected