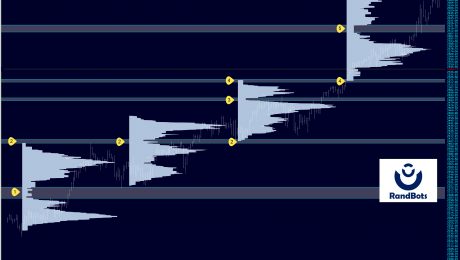
Here are a few findings on the analysis for ES Futures on a market profile chart for 2017 Chart explanation OHLC bars show the daily prices WHITE AREA is a composite of volume traded during each quarter this year Background on market profile VOLUME and MARKET PROFILE can help traders identify areas where market participants do
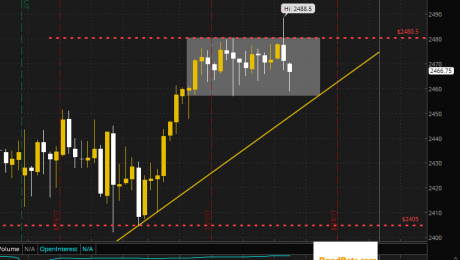
GOLD traded higher and Equities market around the world priced in his words. GOLD futures printed 1282 Technically on the SP500 futures, we are back inside of the range (see chart) after the strong push higher yesterday. Bears pushed the US Indexes negative on the day; today we are still trading lower than yesterday’s low.