
A series of technical indicators used by traders to predict the direction of the major financial indexes. Most market indicators are created by analyzing the number of companies that have reached new highs relative to the number that created new lows, also known as market breadth.
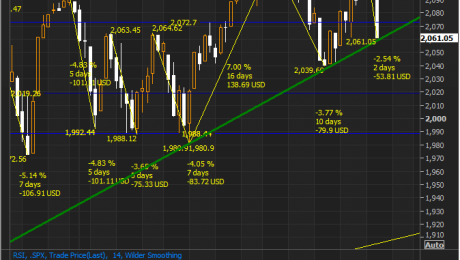
We are trading just at the trendline (green) if the selling pressure does not stop there is a chance to trade to 2000 or bellow to 1990 in the SPX The situation in the Middle East is not helping the markets: “Centuries old conflict between two branches of Islam, Suni and Shia, just escalated. Overnight Saudis
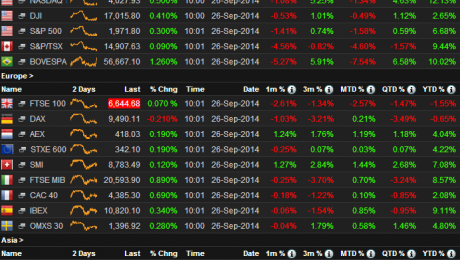
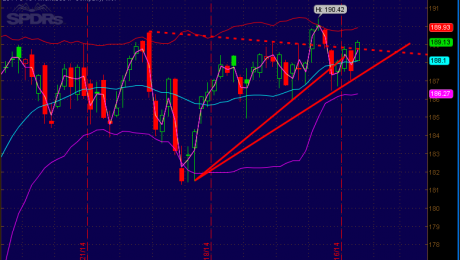
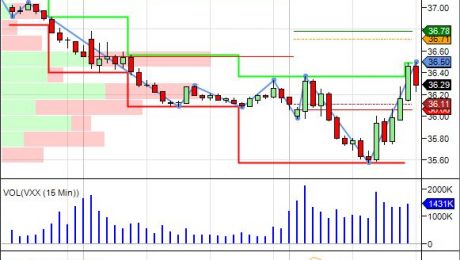
Market Breadth: This is real selling – will it last? Stocks on Wall Street began the session in negative territory, extending yesterday’s slide, and have remained there throughout the morning. The Dow is down about 1%, though that decline is less than either the S&P 500 or Nasdaq have experienced. The blue
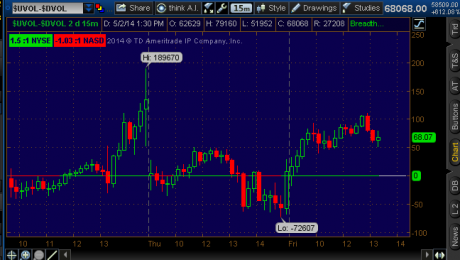
NASDAQ Market Internals – Volume is lighter than average for this time of day. Breadth is mixed with issues and volume bullish while new highs to new lows are bearish (negative divergence). Advancing Issues: 1458 / Declining Issues: 1014 — for a ratio of 1.4 to 1. Advancing Volume: 474,326,695 / Declining Volume: 415,027,726