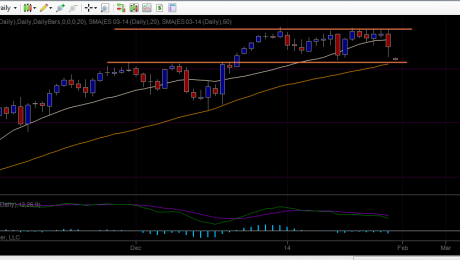
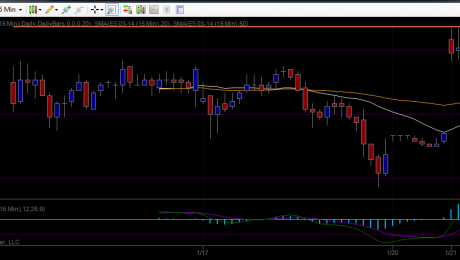
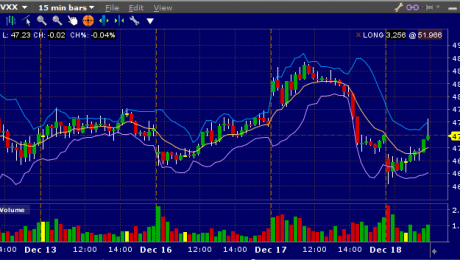
A series of technical indicators used by traders to predict the direction of the major financial indexes. Most market indicators are created by analyzing the number of companies that have reached new highs relative to the number that created new lows, also known as market breadth.
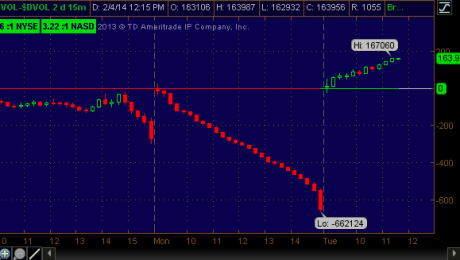
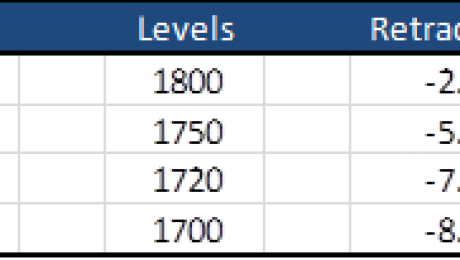
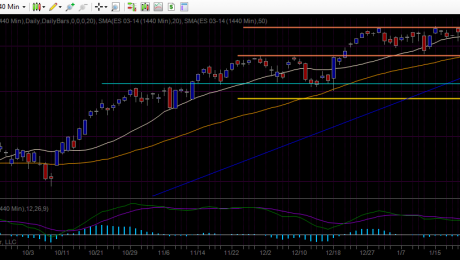
The market had a continuation sell off and tested the Light Blue line I mention yesterday in the video. As we can see from the chart the market correction is already significant and we are moving to oversold levels in the short term. My algorithms are giving buy signals here – however because of risk