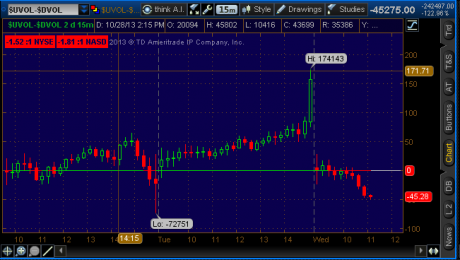
A series of technical indicators used by traders to predict the direction of the major financial indexes. Most market indicators are created by analyzing the number of companies that have reached new highs relative to the number that created new lows, also known as market breadth.
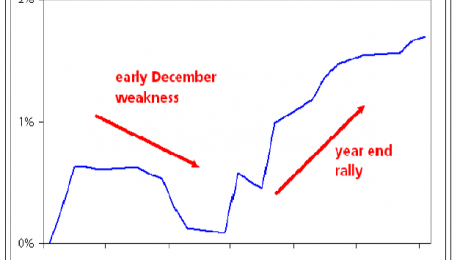
Below there is a chart aggregating the SP500 December returns from 1982 to 2013. Keep in mind, no bull market ends with a high momentum top. The sentiment is still extreme, which implies the risk of a correction, and in this context we said and still think that the recent weakness/pullback was just the beginning
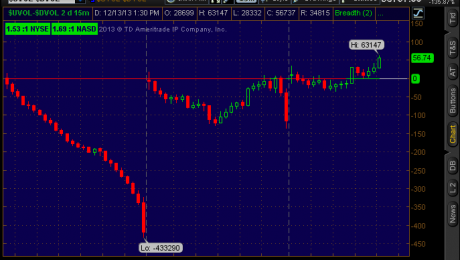
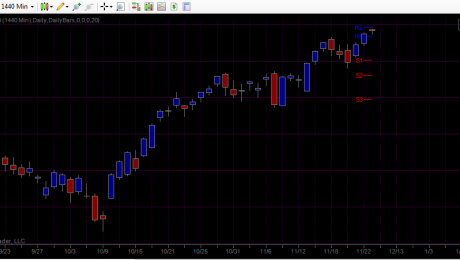
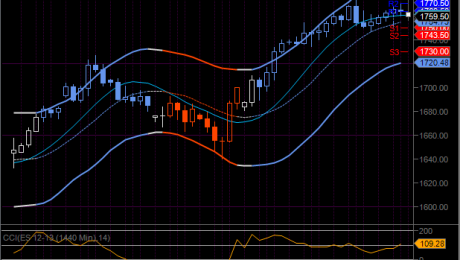
ECB unexpectedly cut its main benchmark rate by 25 basis points to 0.75%. Euro is falling against the dollar. Gold investors should take note that the reason behind ECB rate cut is fear of deflation. Today the market had an important gap up which we used to sell long term SPY positions. The marke internals